IHRSA has released its annual Industry Data Survey (IDS) results and the accompanying publication, 2019 IHRSA Profiles of Success. The report provides a detailed analysis of the annual performance of US private sector health and fitness clubs in areas such as revenue, membership growth and retention, traffic, payroll, non-dues revenue and EBITDA.
“2019 Profiles of Success shows US clubs have maintained strong performance over the past two years,” says Jay Ablondi, IHRSA’s executive VP of global products. “Overall, clubs reported favourable indicators in revenue, membership, and operations. The report provides benchmarks for club operators to compare their performance against, along with analyses by club type and size.”
Profit centre analysis
Multipurpose clubs reported that 7.7 per cent of total revenues are coming from PT services, 5.7 per cent from racquet sports, 4.3 per cent from spa services, 3.9 per cent from F&B, and 1.9 per cent from children and youth programmes.
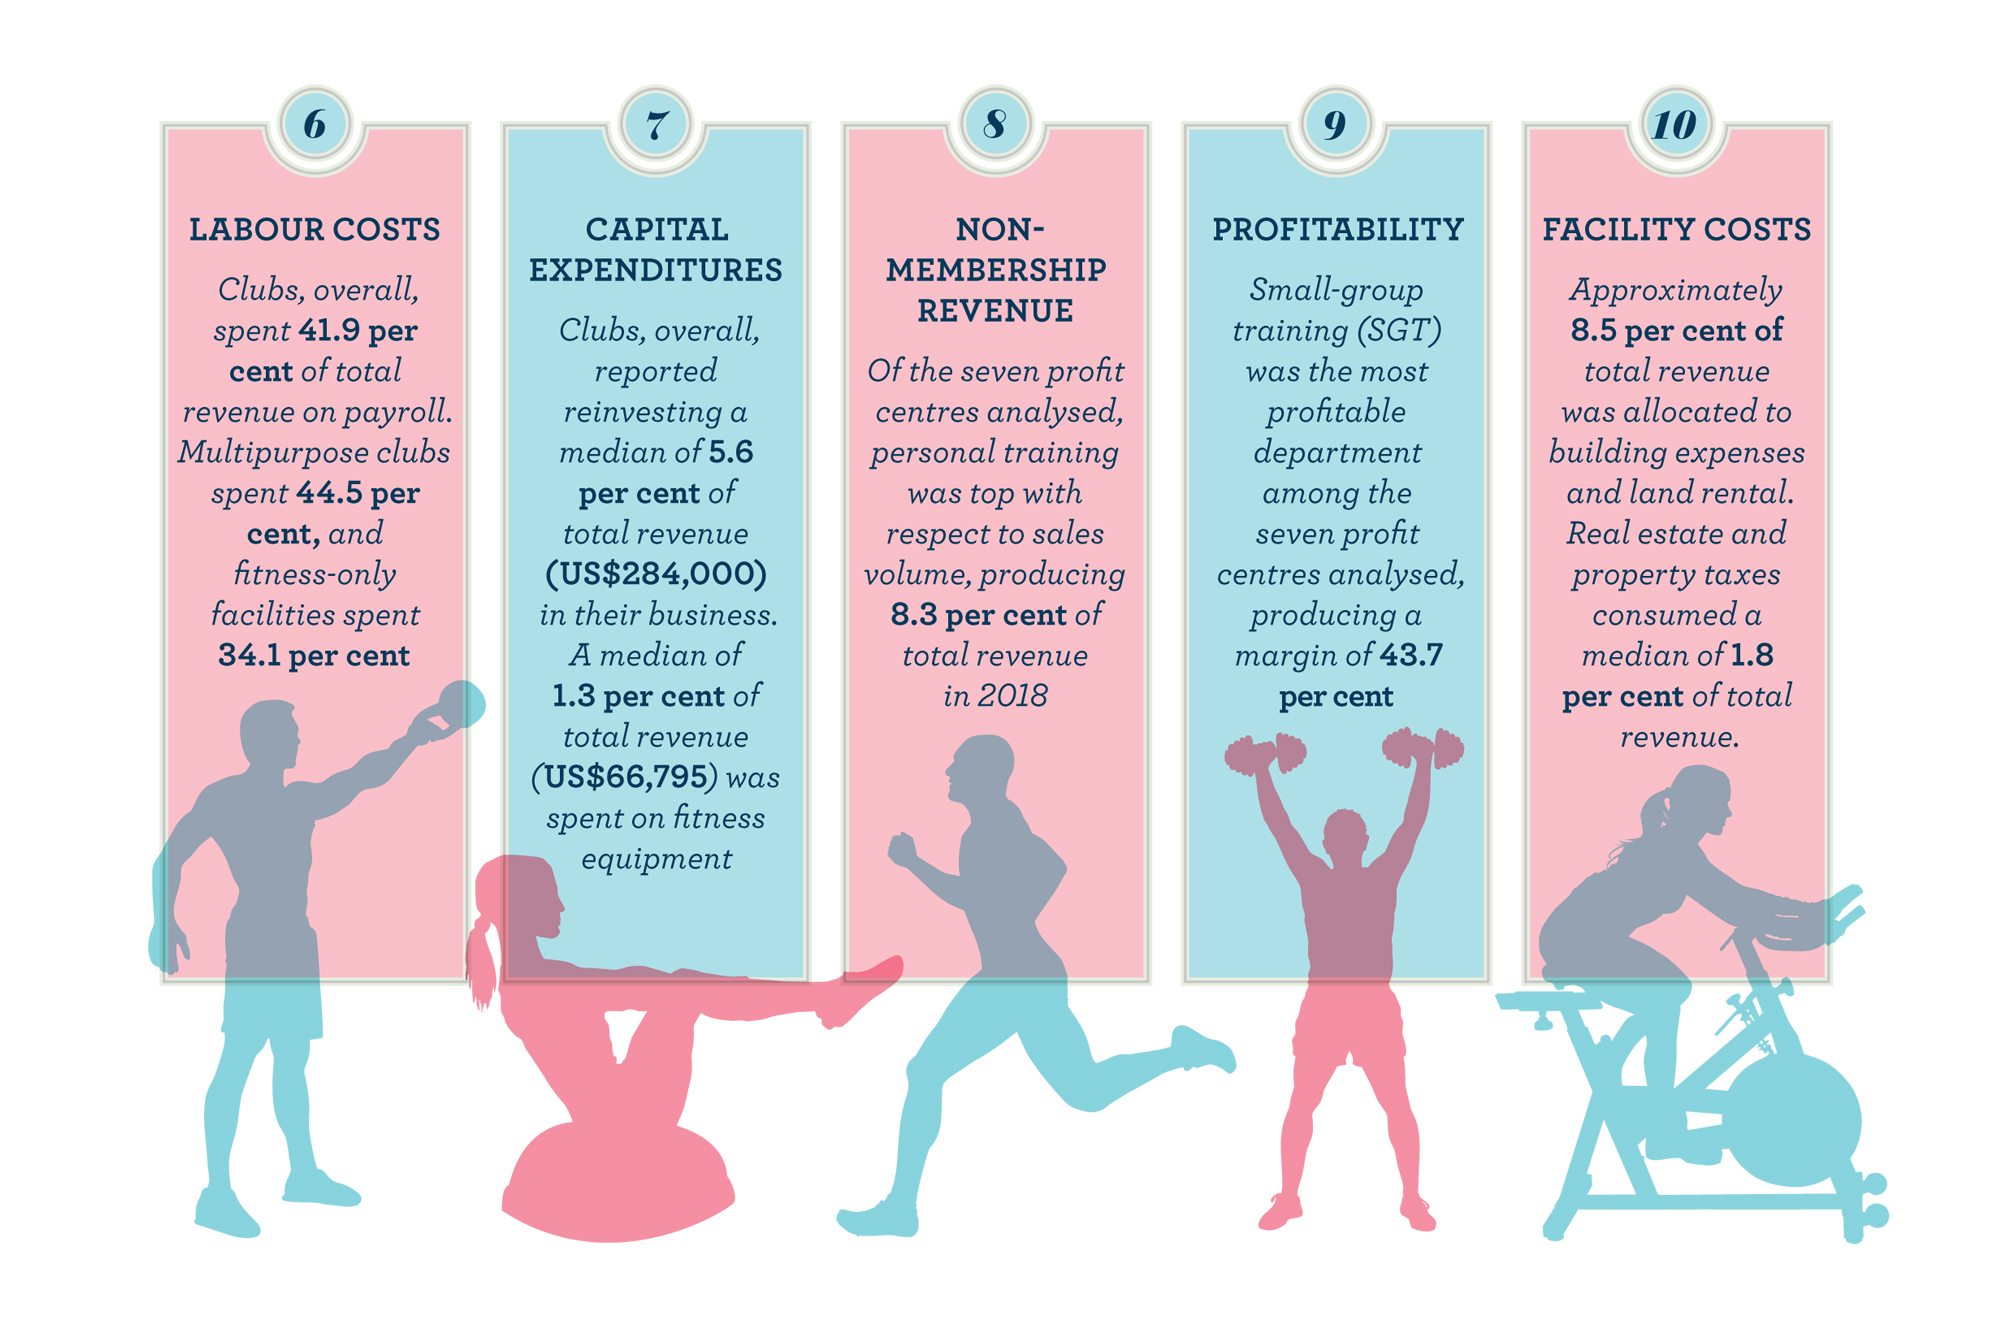
For fitness-only clubs, fitness offerings accounted for a large portion of non-dues revenues, with PT accounting for 15.5 per cent of total revenues.
Although fitness-only clubs and multipurpose clubs can operate similar department/profit centres, profit margins for the various departments vary depending on how the department is operated. For example, some multipurpose clubs operate these departments more as a volume business or as value-adds to their core membership. They may even operate some as loss leaders to differentiate their clubs as an experience, rather than simply a destination.
Change by month
As consumers set health and fitness resolutions in the new year, member accounts added versus those accounts dropped are significantly higher from January to March and in 2017-18, the difference in percentage added versus the percentage dropped in January was positive and the largest it has been in the last five years.
July and August are typically months in which the number of dropped accounts outpace the number of accounts added. Respondents also reported a higher percentage of dropped accounts in September and October, but November and December reported a higher positive percentage.
Retention and visits
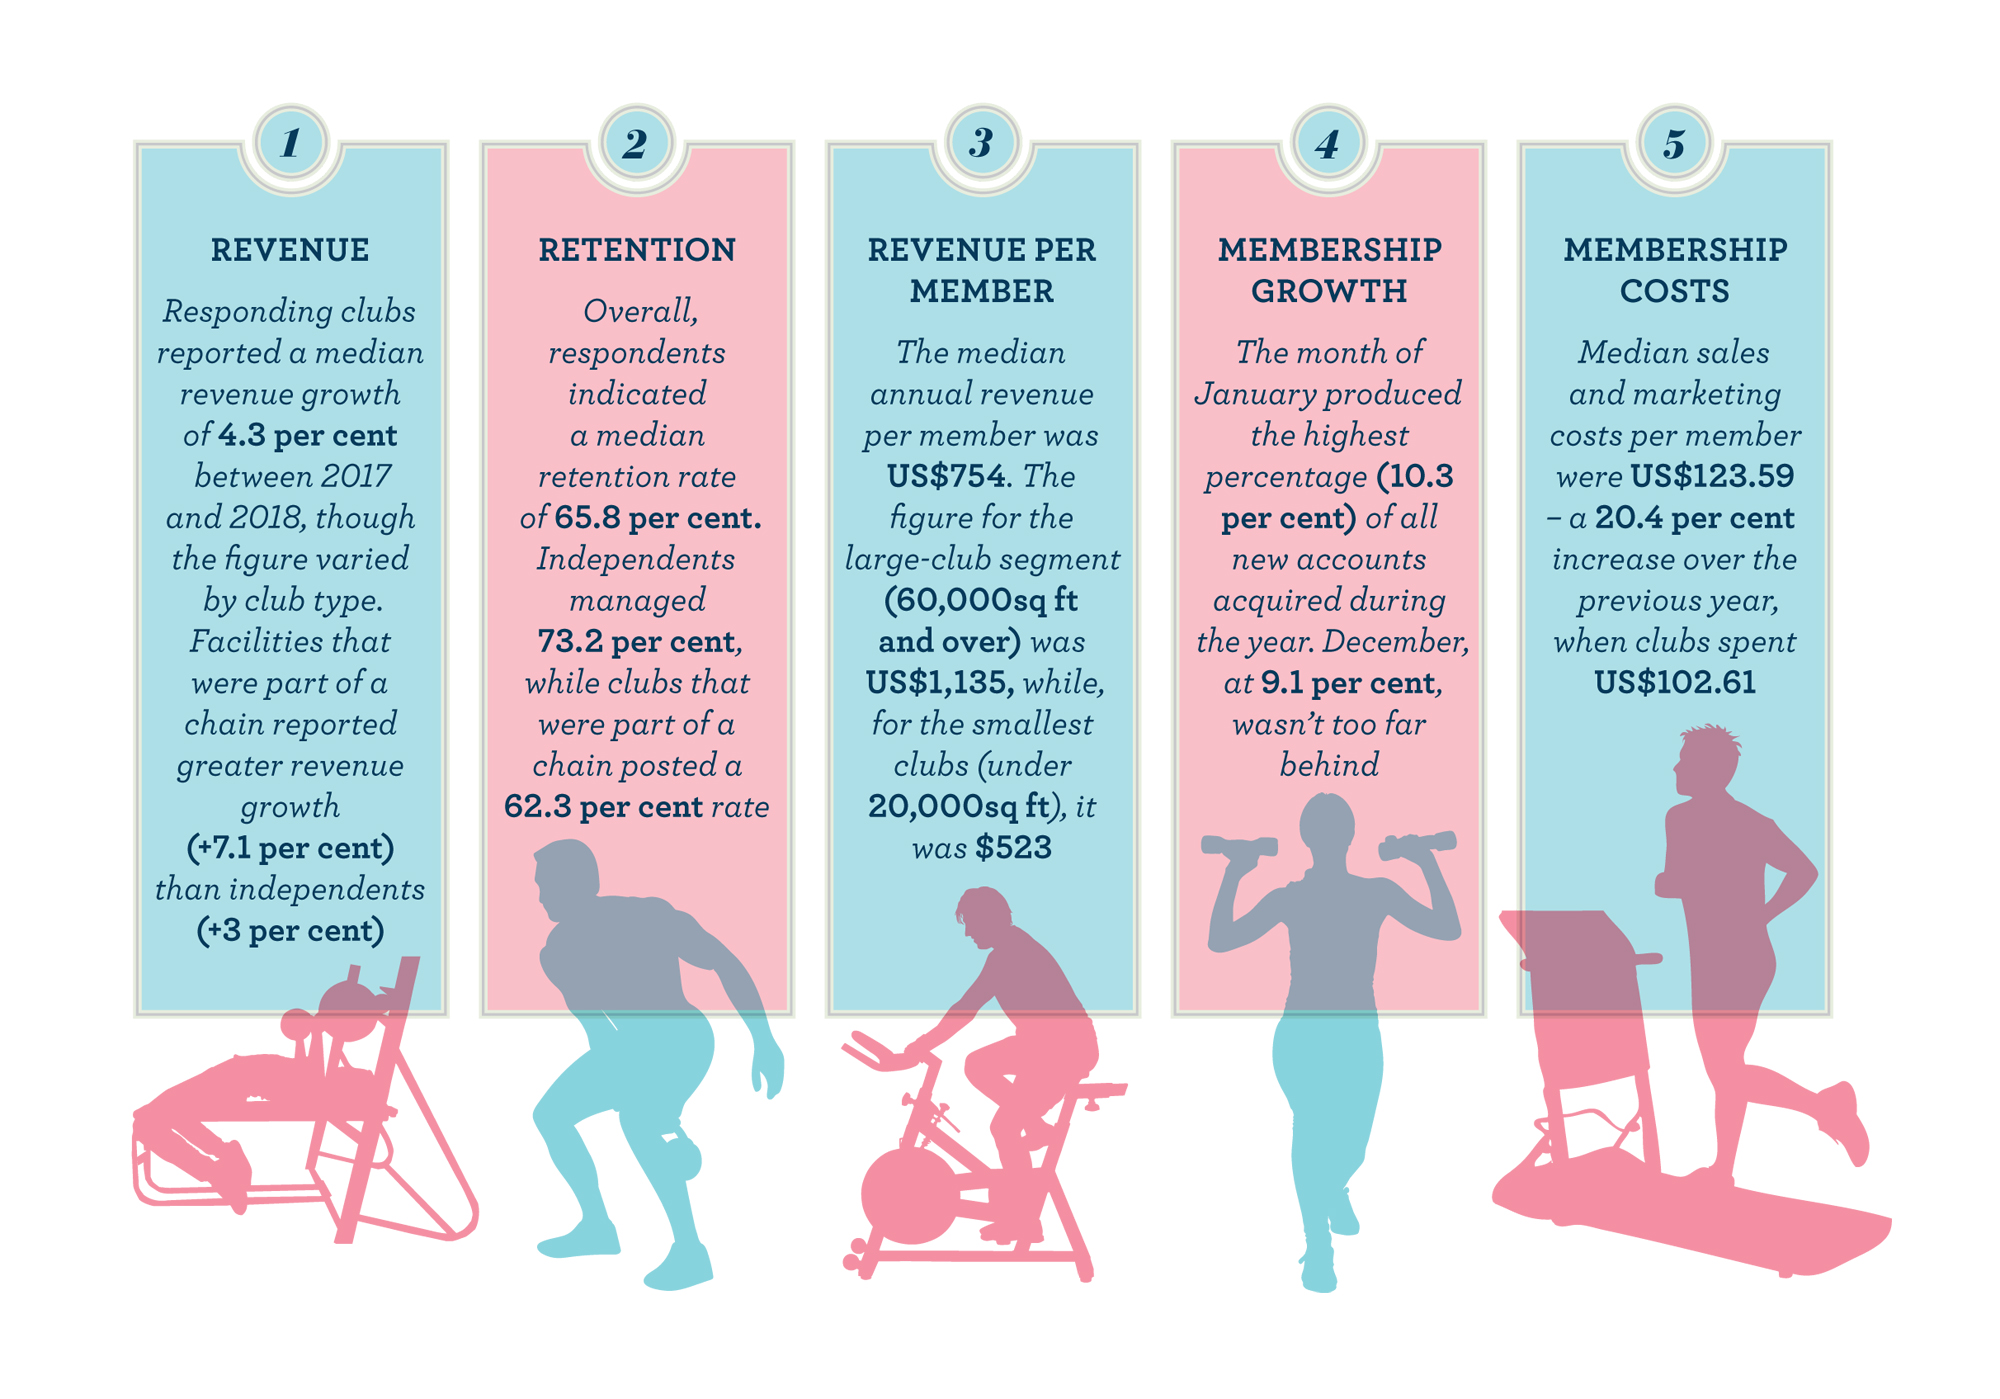
Clubs in the sample reported slightly lower retention rates, but still managed to retain nearly seven out of 10 members in 2018.
This varied by club type and club size. Multipurpose clubs reported a stronger membership retention rate when compared to fitness-only clubs (73.9 per cent, versus 58.4 per cent) and independent clubs reported a significantly higher membership retention rate compared to clubs that are part of a multi-club group or chain (75.8 per cent, versus 62.3 per cent).
When analysed based on the size of the clubs, those with 60,000sq ft or more reported the highest member retention rate at 76.3 per cent.
In 2018, all clubs reported a median of 57 visits per member per year, up slightly from the 54 visits reported for 2017.
Multipurpose clubs and fitness-only clubs reported 55 and 61 visits per member, respectively. Clubs that are part of a multi-club group or chain reported 56 visits per member versus 57 visits per member at independent clubs.
Clubs with 35,000-59,999sq ft reported only 52 visits per member while clubs with over 60,000sq ft reported 59 visits per member.
Net membership growth
Net membership growth was mixed across the numerous reporting segments, but the overall trend was that of continued growth – albeit at a slower pace than 2017.
Overall, clubs in this sample reported membership gains of 2.7 per cent between 2017 and 2018. Fitness-only clubs experienced higher membership growth than the multipurpose clubs, growing at 2.2 per cent in 2018, against 1.7 per cent in 2017.
It’s important to bear in mind that some of this change is due to results from smaller-scale fitness-only clubs, where a small increase in number of members has a greater impact from a percentage point of view.
Smaller clubs with less than 20,000sq ft reported the highest percentage increase in the total number of members added in 2018, at 11.5 per cent.
While a constant stream of new members is the lifeblood of a health club, the number of new accounts is also an important metric. IHRSA defined membership accounts in this year’s survey to include both family and individual memberships.
The typical chain club added 810 accounts over 2018. The typical independent club, on the other hand, added 1,000 accounts. When comparing clubs by type, multipurpose clubs added more accounts than smaller, fitness-only clubs. The typical multipurpose club added 1,031 accounts last year, while the typical fitness-only clubs added 648 accounts.
In 2018, all types of clubs were about even in terms of account replacement. The member account replacement ratio for 2018 was nearly 1.07, meaning that for every 107 accounts sold, 100 accounts closed. This metric is worth monitoring, as this is a drop when compared to 2017.
Additionally, this is below the range logged in recent years of 1.10 to 1.20. For context, this ratio was 1.29 pre-2009.