The TEA/AECOM Theme Index and Museum Index is a collaboration of the Themed Entertainment Association (TEA) and the Economics practice at AECOM.
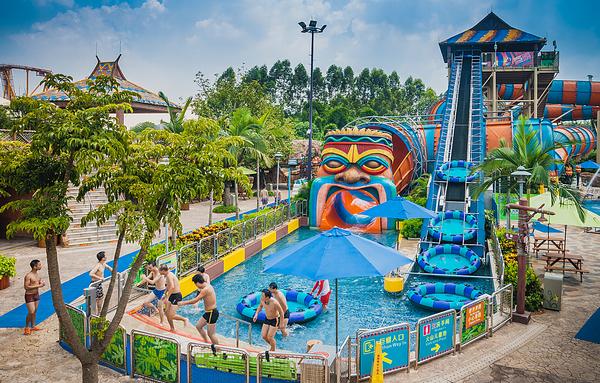
This calendar-year study of global attractions attendance is a free resource for park operators, land developers and the leisure industry. Top worldwide theme parks, amusement parks, waterparks, museums and theme park group operators are named and ranked by attendance and industry trends are identified. The global market is studied as a whole, and each of its main regions is also studied separately: the Americas, EMEA and Asia-Pacific. There is also a focus on waterparks and a table listing the top global chain operators in themed entertainment.
The big picture
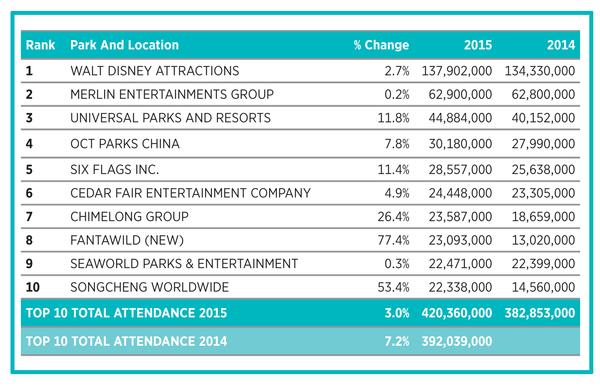
The attractions industry witnessed another year of solid global growth in 2015. With aggregated attendance across the top 10 operator groups increasing by 7.2 per cent during the course of 2015 to around 420 million visits, the level of growth seen this year is strong and encouraging for what is typically considered a well-established industry.
The shifting composition of the world’s top theme park groups is largely driven by a combination of longstanding US operators, most notably Disney and Universal, and fast-emerging major Asian operators, such as OCT Parks China, Chimelong, Fantawild and Songcheng, who are rapidly climbing up the ranks.
European operator Merlin Entertainments is paying close attention to building up its portfolio of midway attractions. The launch of seven new such attractions in 2015 – including Shrek’s Adventure in London and Sea Life in Auburn Hills, Michigan – ensured group numbers remained buoyant in second place despite the difficulties faced by their resort theme park arm following the devastating crash at Alton Towers last year.
Asia strengthens
Generally speaking, the geographic distribution of the world’s top 25 parks has moved eastwards since 2005, with APAC capturing market share (+7%) to the detriment of both the US (-5%) and EMEA (-2%). Strong demographic fundamentals and a widespread operator focus on park additions and expansions in the APAC region point towards a continuation of this trend over the medium term.
Furthermore, a development focus on second-tier cities can be observed, although predominantly in China where there has been a notable shift in the development of new parks from primary seafront cities to inland cities in central and northwest China.
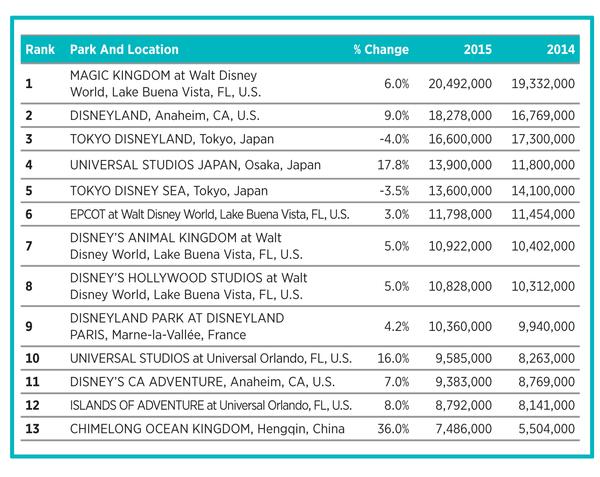
That said, Florida remains dominant as the world’s leading theme park destination, home to no fewer than seven of the top 25 theme parks, with a combined attendance of more than 77 million visitors in 2015 – around one-third of aggregate attendance to the world’s 25 most visited parks.
Europe’s ups and downs
The European theme park market witnessed a second year of modest post-recession growth in 2015, with attendance levels edging up 3.2 per cent following the 3.4 per cent increase in 2014. Visitation to EMEA’s top 20 theme parks reached 61.2 million, up from 55.6 million in 2014.
Disneyland Paris enjoyed a rebound year, reporting an attendance upswing for the first time since 2012, underpinned by improvements to the economic climate in France and significant capital investments, including new IP-branded experiences revolving around Star Wars and Frozen.
Further, in marking its 40th anniversary in 2015, Europa Park posted an impressive 10 per cent increase in visitation, once again proving the family-owned attractions can move from strength to strength despite tough competition from dominant international operators.
Attendance levels at Alton Towers and Thorpe Park were severely suppressed in the aftermath of a tragic accident that occurred on the Smiler ride at the beginning of last year’s peak season.
The decline in attendance at these two popular parks has impacted the overall picture for the region and to get a clearer view on what the sector may have looked like without this tragic incident, we assumed the average growth of the other Merlin parks for this year for these two parks, which would have resulted in growth for the EMEA’s top 20 parks of 4.9 per cent instead of the reported 3.2 per cent. This not only highlights the impact of what happened, but also, most importantly, that there is an underlying picture that is very healthy for the European market as a whole.
Decade of growth
In AECOM’s 10 years of closely tracking attendance in the themed entertainment industry, we’ve seen marked improvements in attendance (despite a global recession), the adoption of exciting new technologies and the continued internationalisation of the industry. Attendance at major European theme parks has grown steadily during that time – predominantly organically rather than with the addition of new parks.
Europe represents a mature, relatively stable market, so growth prospects are stronger in Asia and the Middle East – which benefit from booming populations and increasing disposable incomes.
While 10 years ago European parks captured a 13 per cent share of global attendance, by 2015 this had slipped to 11 per cent as the larger APAC market came into its own.
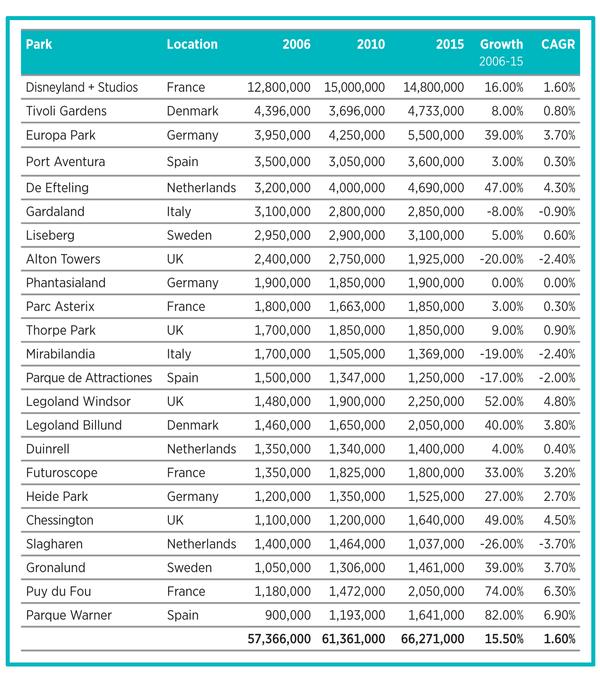
The TEA/AECOM Theme Index’s 10-year anniversary allows us to take a longer view back and we have assembled a table of information tracking attendance at the 24 European theme parks that are familiar within the Index. Assuming stable attendance for Slagharen this year and having combined attendance of the two parks in Marne-la-Vallee, France, the following picture emerges (see Table 1).
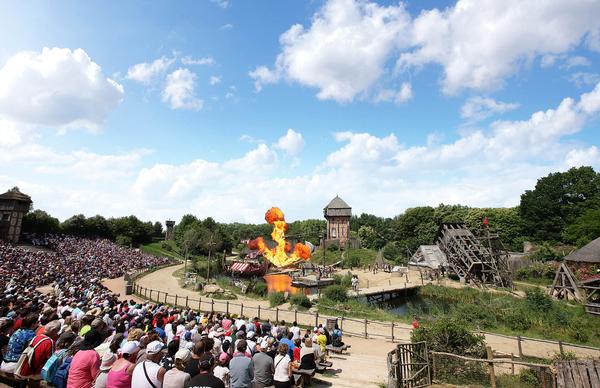
There are some clear winners and losers in this picture (disregarding the Alton Towers results as we hope this year will have been an anomaly for them). We observe outstanding, solid performance over that time period from Puy du Fou and Parque Warner, both achieving compound annual growth rates (average year-on-year growth) of more than 6 per cent.
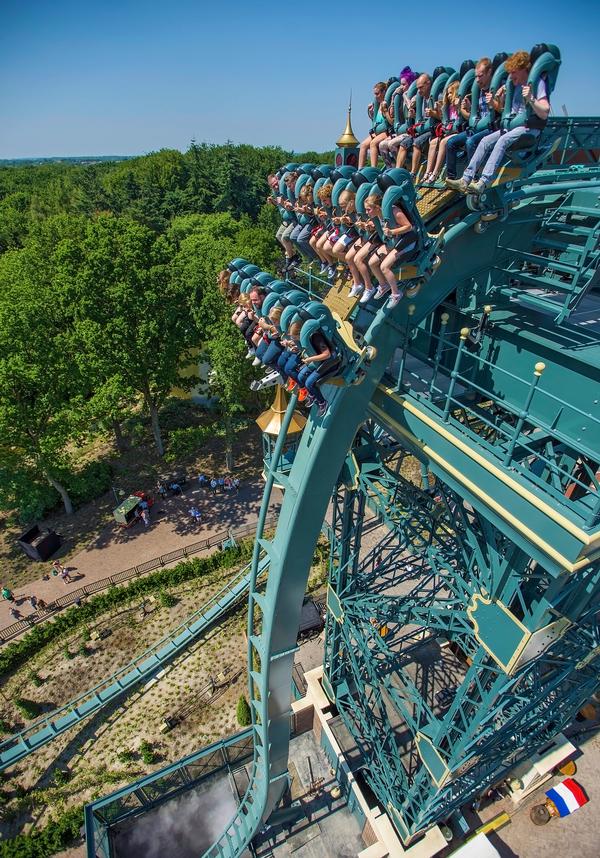
In the middle field, there are some great performances from Europa Park, De Efteling, Legoland Windsor, Legoland Billund, Futuroscope, Chessington and Grona Lund, with growth rates reported of between 3 and 5 per cent.
The majority of the lesser performing parks seem to be in Southern Europe, where recovery from the latest recession has been slower, indeed, Mirabillandia and Parque de Attractiones have both slowly slipped from the top 20 over time. Who knows, they may be back soon?
Looking ahead
The UAE theme park business is seeing massive waves of investment in the lead up to Expo 2020. Mega developments, such as Dubai Parks & Resorts and IMG World of Adventure, are being launched with such huge ambition that some cautiously question their ability to deliver the attendance figures that have been forecast in this somewhat immature market.
However, the creation of an entertainment destination in a sunny climate may well prove a success for the entire region. The industry’s growth prospects in the Middle East are very much underpinned by ambitious tourism projections, in line with Dubai’s mandate to attract 20 million visitors by 2020, coupled with a perceived lack of entertainment provision in the market, strong international accessibility, a developed tourism infrastructure and the presence of international landmarks. For now, we wait and see; however, it’s clear the UAE wants to compete not just on a local or regional level, but on a global level.
Throughout the EMEA region we are seeing increasing interest in smaller themed attractions, such as FECs. This sub-market of the industry is currently undergoing a period of significant growth, and interestingly it is doing so in mature markets such as the UK, France and Spain.
Retail partnerships
Attractions operators are tapping into secondary cities, working with retail operators to introduce leisure as a key diversifier to help mitigate the pressures on the sector caused by changing shopping behaviour. Retail is emerging as a leisure activity. Its merging with other leisure activities is a logical extension of the development of shopping destinations. IP providers are eyeing this market and the potential it holds.
Technological advancement is shaping the industry like never before. Augmented reality equips leisure developers with the ability to create virtual content within applications that blend in with the real world. A seamless guest experience, from sofa to rollercoaster, is already being adopted by some parks through the creation of dedicated mobile applications.
We can expect to see the transformation of attractions from passive amusements into engaging, immersive adventures, the development of VFX simulations of rides and more hi-tech, show-orientated experiences which are tied to seasonal events.
Outlook
As geopolitical tensions mount in Europe, heightened by Brexit, we anticipate continued macroeconomic uncertainty over the next year and thus a likelihood of volatility in the industry over the short term. How this translates into tourism volumes, leisure spending and, ultimately, attendance at attractions remains to be seen.
Concerns around London trading and the pace of the Alton Towers’ recovery are also weighing negatively on sentiment. However, we’re still looking on the bright side, following two years of growth in the sector, the increased focus on, and proliferation of, smaller attraction concepts, and continued diversification across geographic markets among leading international IP providers and attraction operators.
Life is a rollercoaster!