Benchmark data for spas in South Africa have been released for 2014 – following on from previous research conducted five years ago. The key figures show that there’s been increase of 261 per cent in the region’s industry revenue up to 31 March 2014, reaching ZAR1.4bn (US$118m, €108m, £78m).
The figures were recently revealed by independent research company Intelligent Spas, which was commissioned by the South African Spa Association (see p340) to update its previous South African Spa Benchmark Report 2009.
Growth overview
According to the data, the number of spas in the country has more than doubled – there are now 494 facilities, compared to 204 five years ago (see Table 1).
The size and range of facilities of these new properties is greater too. The report puts the average size of a spa in South Africa at 5,958sq ft (554sq m) and although this may not sound particularly large in global industry terms, it’s a 34 per cent national increase from 2008. The number of combination dry or wet treatment rooms rose by 33 per cent over the same period.
Around 2.5 million consumers visited a spa in South Africa in the financial year ending 31 March 2014. This represents a 162 per cent growth since 2008. And the good news is that annual revenue per spa facility went up as well – on average spas bring in ZAR2.8m (US$236,950, €216,000, £156,100) a year, marking a 49 per cent rise in five years.
Given this growth, it’s no surprise that the workforce has followed suit and is nearly double what is was in 2008. As of 2014, spas in South Africa employed almost 5,000 people compared to just over 2,500 in 2008.
Indicators in-depth
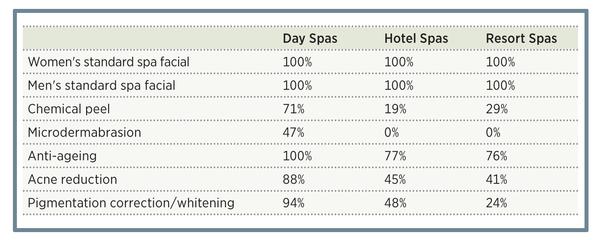
In 2014, South African spas had an average annual treatment revenue per venue of ZAR1.85m (US$156,550, €142,700, £103,150). Broken down further this amounts to around ZAR695 (US$59, €54, £39) per person per visit, a 17 per cent rise since 2008. Massage services accounted for 34 per cent of revenue, yet the report also found that there’s a rising demand for customised treatments – particularly specialist facials such as those reducing acne or pigmentation.
Julie Garrow, founder of Intelligent Spas and report author says: “It was not surprising to see a higher proportion of day spas offering specialist facials, but it was interesting to confirm both hotel and resort spas also cater for most types of facials. Table 2 shows that 29 per cent of resort spas offer chemical peels and 45 per cent of hotel spas provide acne reducing treatments.”
Overall, 39 per cent of total expenses in 2014 was allocated to salaries, wages and bonuses. Average revenue per employee was ZAR301,835 (US$25,550, €23,300, £16,850). Or if you look at it another way, there was an average 489 annual visits per employee – up 22 per cent since 2012.
Women were the greatest users of spas, representing 70 per cent of clients in 2014 compared to men at 30 per cent. The majority of spa-goers were aged between 30- and 49-years-old. And report figures highlight the importance of the local market – on average, 46 per cent of customers were nearby residents, 25 per cent were domestic tourists and 29 per cent were international tourists. Sixty-six per cent of total spa visits at resorts and 31 per cent of visits to hotel spas were from guests staying at the property.
The repeat visitation rate sat at 38 per cent – a figure that sounds reasonably high in industry terms, but which was actually a 16 per cent decrease since 2013 for spas in South Africa.
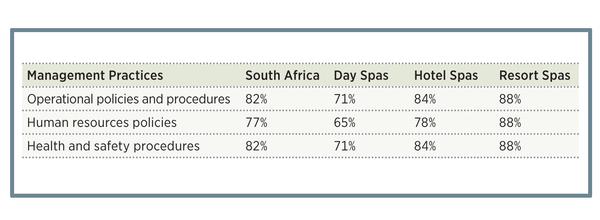
As part of the report, Intelligent Spas asked spa owners and managers what operational and management practices they implement (see Table 3) and found that resort and hotel spas are more likely to have policies and procedures in place. Day spas fared the worst – 35 per cent of them do not use human resource policies and, perhaps more alarmingly, 29 per cent do not have health and safety procedures in place.
Garrow says: “Policies and procedures are important not only to maximise customer satisfaction and profit, but also to minimise legal and financial risk.
“Not training staff in such important procedures could result in employees being forced to work in unsafe environments and customers being exposed to hazards. Spas should also be mindful of the consequences of negative social media comments if an incident occurs.
“Often it takes just a few steps to improve a problem area, so it’s not difficult to take action to ensure a safe and healthy environment for your employees and customers to enjoy.”
In the future, Intelligent Spas predicts that day and resort spas will face particularly tough times in the year ahead. It calculates a decrease of annual visits per venue of 22 per cent and 16 per cent respectively in 2015. In total, however, it estimates an overall rise in annual visits per spa of 1 per cent – not a high number compared to previous years, granted, but an increase nonetheless.