The most recent research on UK health club member retention reveals a worrying decline in an already unsatisfactory situation – namely the industry’s ability to retain members.
The first study of this type was conducted as part of the FIA’s (now ukactive) Winning the Retention Battle series, conducted by Dr Melvyn Hillsdon back in 2002. At that time, from a sample of just over 70,000 members, 60 per cent retained membership for 12 months. The subsequent national study in 2008, involving 293,000 members, revealed that 66 per cent of members had retained their membership for 12 months.
But the latest figures have fallen back down – and beyond. Based on 342,759 member records and covering the four-year period from 2009–2012, The National Retention Report (see information panel, p66) indicates that only 52 per cent of members are maintaining membership at their club for 12 months.
Although comparing data from different samples is not the most academic research approach, nevertheless the findings allow us to draw some broad conclusions, as well as allowing us to identify some of the characteristics that defined the market then and now, helping us understand where the key changes have been taking place.
Scores on the doors
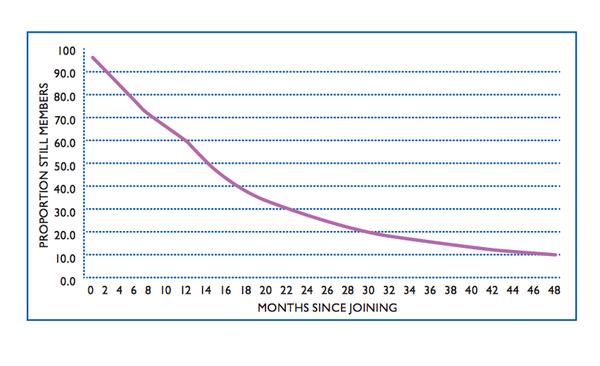
Our report shows that 51.9 per cent of members retain membership for at least 12 months; 24.4 per cent are still there after 24 months; 14.1 per cent survive to 36 months; and only 10.4 per cent are members to 48 months. (see Figure 1)
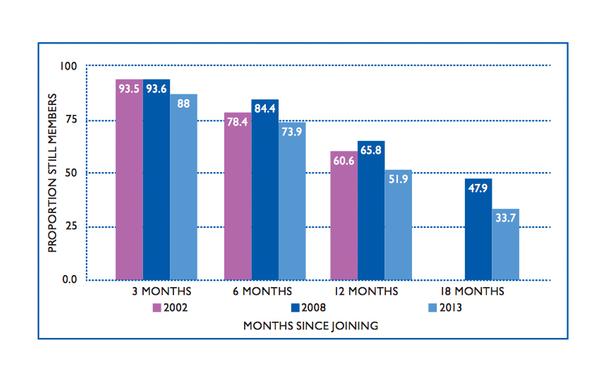
Figure 2 gives an overview of retention rates for specific periods of membership, providing a comparison of our 2013 report with the findings from 2002 and 2008. You can see that at each period, the 2013 results are worse than previous years. In 2002 and 2008, more than six out of 10 members retained their membership for at least 12 months, compared to five out of 10 in 2013.
Within this, there are some interesting variances by age. The latest report identifies that members aged 16–24 years have a 12-month retention rate of 50 per cent compared to those aged over 55, 66 per cent of whom stay for a year. By the end of the study period (48 months), only 5 per cent of the 16–24 group were still members, compared with 22 per cent of those over the age of 55.
Meanwhile, when data is analysed by contract length, 48 per cent of those on one-month agreements complete 12 months of membership, compared to 65 per cent of those on a 12-month contract. This lies at the heart of the difference in retention rates between the public and private sectors: private operators perform significantly better than the public sector for the first 11 months, after which retention rates level out across the board.
Turning to attrition, in 2008 clubs lost members at an average rate of 35 members per thousand members per month. In this new study, they lost them at a rate of 55 per thousand members per month. That’s a loss of an additional 240 members a year that need replacing.
When these figures are scaled up to a national level, the size of the problem really becomes clear. In the 2012 State of the UK Fitness Industry Report, produced by The Leisure Database Company, there were 7,601,114 health club members in the UK. If you extract the 2012 retention figures from The National Retention Report, this would equate to a loss of 3,952,579 members.
Many of these will, of course, have left one gym to join another – it’s not currently possible to track that change (although this could be remedied were the industry to adopt a single, individual membership approach similar to National Insurance numbers, allowing us to track ‘loss to industry’ versus ‘lost to competitor’). However, even acknowledging this, a figure of 3,952,579 annual lapsers is still an unacceptably high number.
Meanwhile, if we look at how long members stay, we can see a wide difference between the best and worst performers. Median length of membership is currently just 12.3 months. However, the worst performing clubs only manage to hold on to members for six months, whereas the best performing clubs keep them for an additional 23.5 months. Based on a club of 1,000 members, each paying £35 a month, that would equate to a difference in income of £595,000 between the best and worst performers.
Customer profile
MOSAIC profiling is used to understand characteristics of households and the individuals living there. The essence of the system is that small areas which share similar housing, lifestyle, demographic and socio-economic features will show similar likelihood of using specific services (eg gyms).
If we review the demographics of the members in The National Retention Report sample using MOSAIC profiling, we can see that the health club industry currently attracts the majority of its members from just seven of the 15 MOSAIC groups. The report suggests the industry is dominated by the middle classes, failing to attract the highest or lowest income groups. Rural areas and older people are also under-represented.
This is true across all sectors. Indeed, while previous reports have shown that MOSAIC types differ by public and private sector, the new report suggests this is no longer the case, with types that were previously only seen in more expensive private sector clubs now being found equally in public sector facilities.
Perhaps most worrying in this is the fact that leisure facilities set up to provide opportunities for the least well-off do not seem to be attracting those groups sufficiently to represent their community.
So why is this happening? Certainly the past four years have seen some dramatic changes in the fitness offering being made available to the buying public.
First of all, the variety of offerings has diminished in the sector. Public sector sites have been rejuvenated by refits and rebuilds, and the quality of the product offering improved.
Public sector operators have also been keen to employ sales approaches that mimic the private sector – the sort of approaches that previously set private operators apart – while still maintaining their community values. In short, they have upped their game.
Meanwhile the private sector has experienced challenging times. Health and fitness clubs have often had to maintain an ageing portfolio of facilities in the face of increased competition from the low-cost market – which has boomed in both private and public sectors – as well as a newly invigorated public sector.
Homogenous offering
In their book Funky Business, Kjell Nordström and Jonas Ridderstråle offer their thoughts on what they refer to as the ‘surplus society’: “The surplus society has a surplus of similar companies, employing similar people, with similar educational backgrounds, working in similar jobs, coming up with similar ideas, producing similar things, with similar prices and similar quality.”
This could also be said of the fitness industry: we’re seeing similar marketing strategies targeting the same types of members, who are being sold similar types of contracts with similar time periods, which provide access to similar facilities and similar classes and equipment. It’s becoming increasingly difficult to separate public and private by facility design, content or contract type.
However, where facilities do have a clear USP, the financial rewards are huge, as can be seen in the best and worst performing clubs example above.
Of course, not all factors relating to retention are entirely under operators’ control: the regulation of length of membership contracts has had an impact, for example, as have the challenges in the wider economy over the last four years.
However, in general, we really haven’t been very imaginative in our offering, nor in the way we provide support to members, with a focus on PT over service. Larger health clubs – those offering gym, studios, tennis, swimming pools – will routinely generate membership revenues of £260k a month. F&B adds another £45–50k and PT just £18–20k. Yet while large amounts of time and effort are devoted to driving up secondary spend, many operators place little effort on improving retention, which is where the big money remains.